
Technical Management
Manage the technical health and assets of your engineering organization through "Decisions" and "Metrics."
Architecture Decision Records (ADR)
Keep an immutable record of technical choices and architectural changes. Create one with "Record ADR" on the "ADR" tab of Technology > Tech Management.
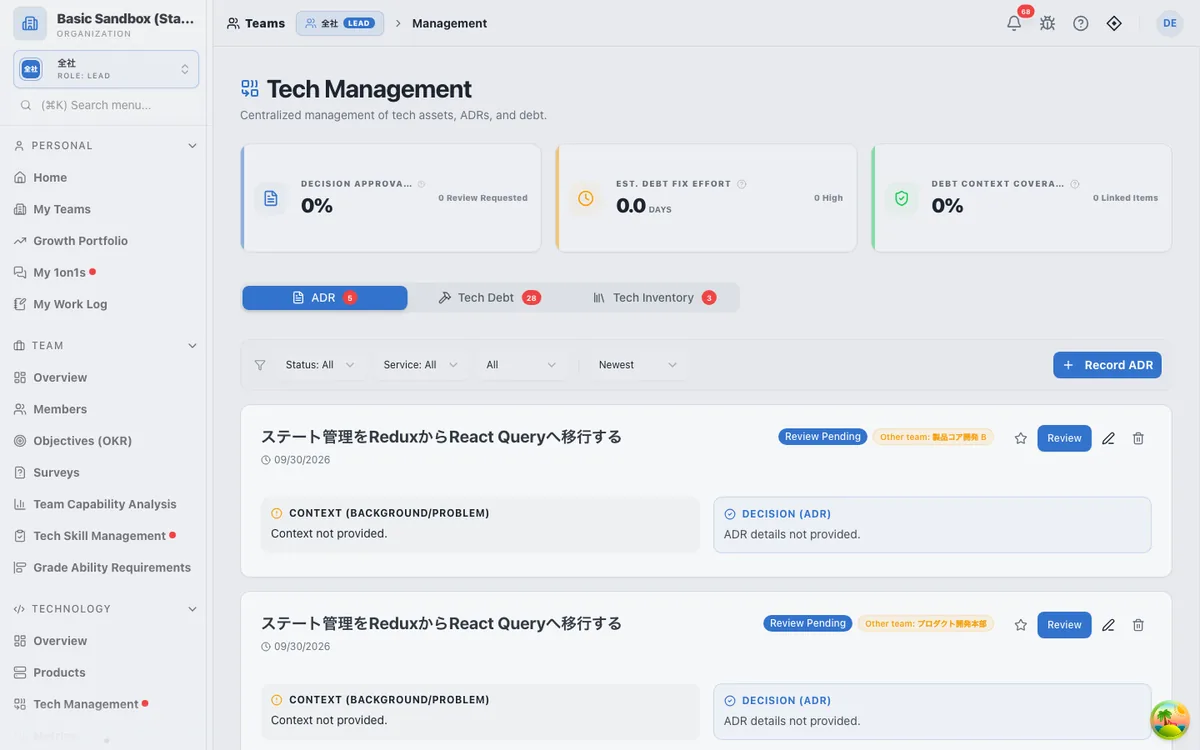
- Workflow:
- Proposed: Propose a new technical choice.
- Accepted: Approved and adopted after review.
- Superseded/Deprecated: Overwrite old decisions.
- Star Feature: Mark critical components (e.g., choice of Database) as "Starred" to highlight core technical stack information.
- Team & Service Liaison: Categorize records by linking them to specific teams or microservices.
Engineering Metrics (Four Keys)
Automatically collect and visualize the four metrics defined by DORA (DevOps Research and Assessment).
- Deployment Frequency: Count production releases via GitHub integration.
- Lead Time for Changes: Average time from commit to production.
- Change Failure Rate: The failure rate of production changes.
- Time to Restore Service: Time from incident detection to resolution.
TIP
These metrics are updated automatically via GitHub Actions workflow completions or Jira ticket status changes.
Service Level Objectives (SLO Management)
Quantitatively define and monitor system reliability.
- SLI (Service Level Indicator): The metric to be measured (e.g., % of API latency < 300ms).
- SLO (Service Level Objective): The target value for SLI (e.g., 99.9%).
- Error Budget: The margin over the target value. Use this as a criterion for deciding whether to invest in "Innovation (feature development)" or "Reliability improvement."
Post-mortems
Manage factual reviews and prevention plans when major incidents or SLO breaches occur.
- Root Cause Analysis (RCA): Use 5 Whys to identify structural issues rather than surface symptoms.
- Timeline Logging: Accurately record the sequence of events from occurrence to detection, response, and recovery.
- Action Item Sync: Directly register decided prevention tasks as "Technical Debt" and track them until completion.
- Blameless Culture: Focus on improving system vulnerabilities rather than assigning individual blame.
R&D / Tech Verification
Strategically manage new technology selection and prototype development.
- Theme Management: Propose technology stacks or concepts to be verified as "Themes."
- Assetize Findings: Register verification reports and sample code as "Artifacts" to accumulate organizational shared knowledge.
- Skill Alignment: R&D results can be automatically reflected in "Team Skills" and "Individual Proficiency."
Team Surveys
A survey feature for measuring Developer Experience (DevEx) and team health.
- Recurring Surveys: Use standard templates such as "eNPS" and "DevEx."
- Anonymity: Collect honest feedback without identifying individuals.
- Result Visualization: Track trends over time and measure the effect of improvement initiatives.
Custom Metrics
Define your own metrics beyond the Four Keys and track them on dashboards. For metrics that cannot be measured automatically, record values with "Manual Entry" in Technology > Metrics.
- Example: "Code Review Turnaround Time" (time until a code review is completed)
- Example: "Bug Bounty Reports" (number of bug reports)
System Topology
Use XYFlow (React Flow) to draw physical and logical dependencies between services.
- Service Catalog: Centrally manage technical stacks (Language, DB, Libraries, etc.).
- Dependency Visualization: Understand API callers and callees in a graph format to identify the impact of changes.
Technical Strategy Roadmap
Visualize mid-to-long term technical investment plans and manage the balance between feature development and infrastructure improvement.
- Strategic Themes: Define high-level goals like "Legacy Modernization" or "Security Hardening."
- Composition Map: Visualize, as a tree, how each strategic theme connects to execution phases (milestones) and to concrete assets (projects, debts, ADRs, R&D themes), making the rationale for each initiative explicit.
- Gantt Chart (Timeline) View: Overview implementation periods and progress on a timeline.
- Intuitive Schedule Adjustment: Adjust schedule dates by dragging the center of a milestone bar, or resize from the left/right handles to extend or shrink the duration. Changes are saved to the server in real-time.
- Today Indicator & Auto Scroll: A vertical line (Today Indicator) marks the current date, and the timeline automatically scrolls horizontally to center today's date upon load.
- Detailed Metadata Visualization: Milestone bars show inline badges for associated project progress (%), resolved/total technical debts, and linked ADR counts. Hovering over a bar reveals a tooltip containing detailed schedule and metadata info.
- Mobile Fallback List View: On mobile devices, the Gantt timeline automatically collapses into a clean accordion list of strategic themes. Under each theme, users can view milestones as vertical cards displaying status badges and metadata.
- Investment Ratio Dashboard: Automatically calculate the percentage of effort allocated to technical strategy compared to total planned effort. Useful for alignment with management.
- Asset Linking: Directly link "Technical Debts" and "ADRs" to roadmap milestones to track resolution progress.